

Bitcoin (BTC/USD) Market Dumps, Seemingly Forming a Bullish Flag

Bitcoin Price Prediction – November 27
Although it may take a while to witness a return of upswings in the BTC/USD trading activities as the crypto-economic market dumps, seemingly forming a bullish flag. Price has slightly pushed southward, trading around $54,482 line at a relatively smaller-positive percentage rate of about 0.99 as of writing.
BTC/USD Market
Key Levels:
Resistance levels: $57,500, $60,000, $62,500
Support levels: $52,500, $50,000, $47,500
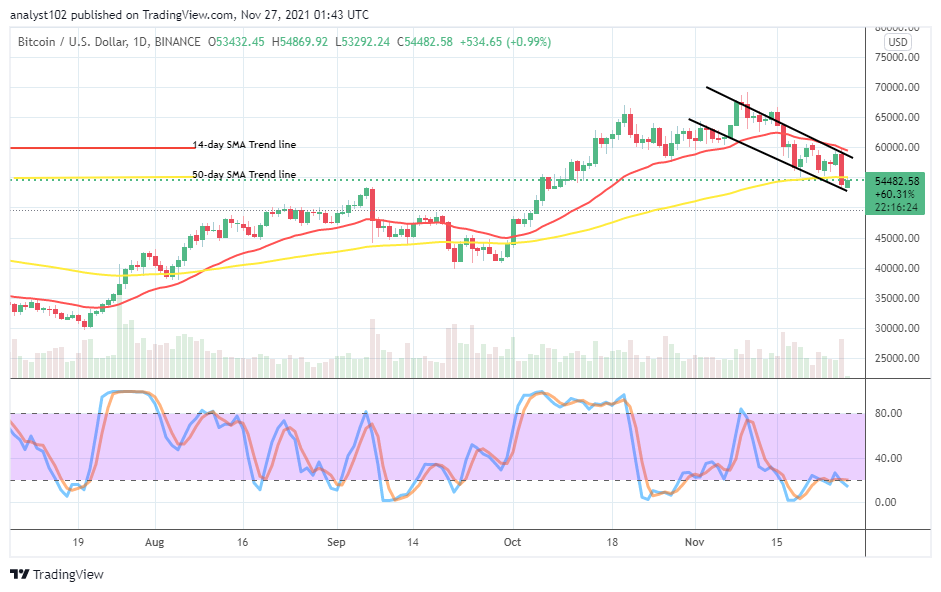
BTC/USD – Daily Chart
The BTC/USD daily chart reveals that the crypto-economic market dumps, seemingly forming a bullish flag. That indicates the need to put the market back on track to the upside if the formation has to be valid. The bearish channel trend lines drew to ascertain the path that price keeps to the correction side. The 14-day SMA indicator is above the 50-day SMA indicator, trying to make a bend southward. The Stochastic Oscillators have initially touched the zero range line. But, they are now at the range of 20, moving in a consolidation manner to signify that some pressures to the downside are still somewhat in place.
At what level could the current BTC/USD trade formation bring back upward effects as the crypto-economic market dumps, seemingly forming a bullish flag?
Two trading levels at $55,000 and $50,000 presently appear to be the zones where the BTC/USD trade may experience upward effects as the crypto-economic market dumps, seemingly forming a bullish flag outlook. Within those points, price tends to take more time to re-energize stances before going for possible presumed upswings by long position takers of the digital coin as paired with the US fiat coin.
On the technical elongation of the BTC/USD price correction, short position takers would have to hold their positions for a long time around the current trading level at $55,000 to be able to push for more possible downs. There is the tendency that the market settles for concurrent moving styles around some points beneath that value line while the level at $50,000 isn’t breached southward afterward.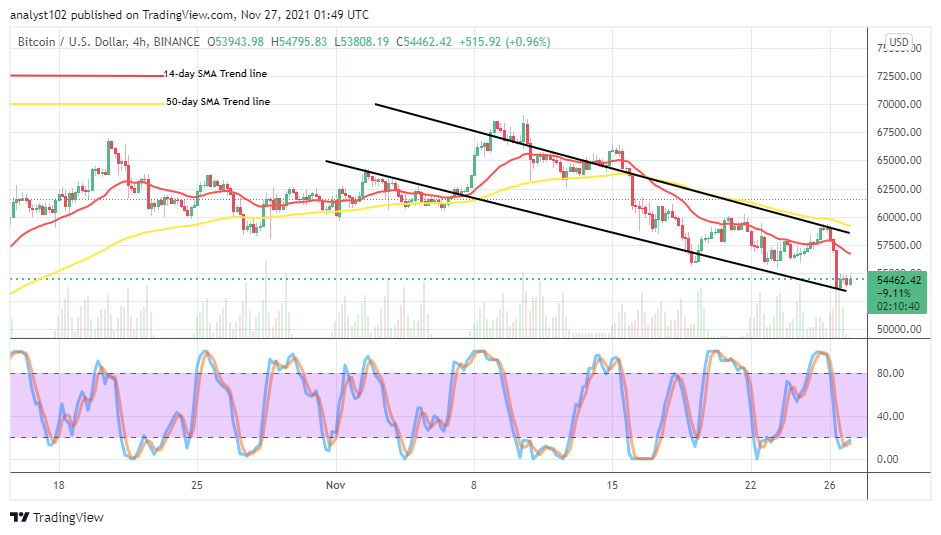
BTC/USD 4-hour Chart
The BTC/USD medium-term chart also showcases a more distinctive outlook that the crypto market dumps, seemingly forming a bullish flag pattern. A bullish flag pattern suggests that the market may in no time regain its lost upward momentums. The 50-day SMA indicator is above the 14-day SMA indicator. The lower bearish channel trend line drew downward close to the psychological support level of $52,500. The Stochastic Oscillators are closely beneath the range of 20 in the oversold region. That suggests that the pressures to the downside are getting reduced gradually. Therefore, traders may prepare to re-shape their positions to determine the following price direction after a while.
Looking to buy or trade Bitcoin (BTC) now? Invest at eToro!
68% of retail investor accounts lose money when trading CFDs with this provider.
Read more: