

Bitcoin Price Prediction: BTC/USD Stumbles Below $59,000

Bitcoin Price Prediction – November 26
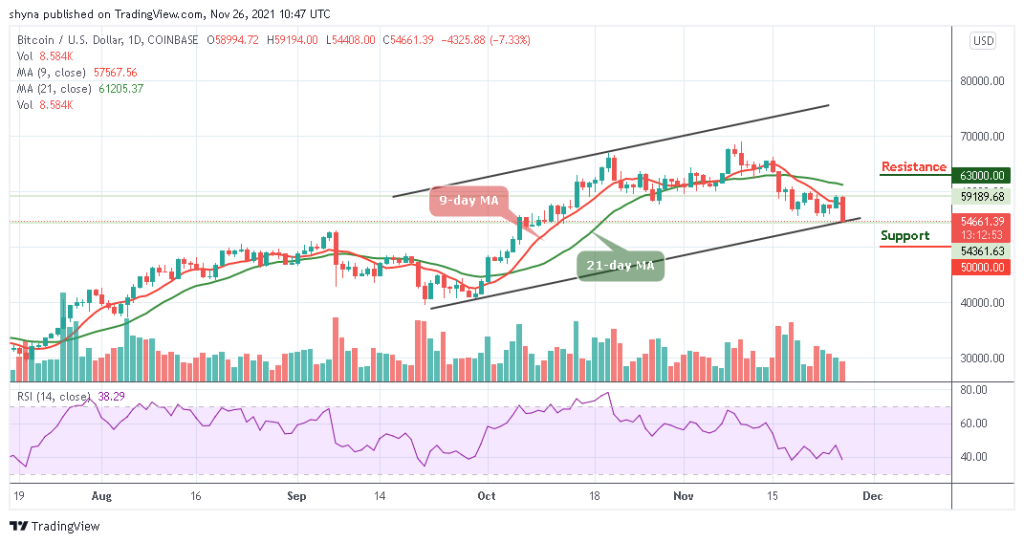
The Bitcoin price path of least resistance remains below the 9-day and 21-day moving averages as the coin loses over $4500.
BTC/USD Long-term Trend: Bearish (Daily Chart)
Key levels:
Resistance Levels: $63,000, $65,000, $67,000
Support Levels: $50,000, $48,000, $46,000
BTC/USD couldn’t maintain its position above the resistance level of $59,000 as its price dives below the $54,000 mark today. The Bitcoin price is in a dangerous position as the price slipped below the nearest support level of $55,000 during the European session. If the breakdown is confirmed, the downside momentum will gain traction with the next focus on $52,000. At the time of writing, Bitcoin is trading below the 9-day and 21-day moving averages at $54,661 with a decline of 7.33% on the daily price chart.
Bitcoin Price Prediction: Bitcoin (BTC) May Crash Below $50,000
As the Bitcoin price rejects the higher resistance level, lower levels may be tested in a sequence of lower highs and lower lows until prices touch the next critical support level. However, the market may experience a lot of short-term based trades and a lot of volatility too as the technical indicator Relative Strength Index (14) moves below 40-level.
Meanwhile, it is important to note that the Bitcoin price is most likely to break south in as much as the 9-day MA remains below the 21-day MA, and its failure to hold above the moving averages may pull the price down to its next support level at $52,000. Therefore, the short-term analysis indicates that BTC/USD may test higher and the resistance levels are located at $63,000, $65,000, and $67,000 while the supports could be found at $50,000, $48,000, and $46,000 respectively.
BTC/USD Medium – Term Trend: Ranging (4H Chart)
According to the 4-hour chart, BTC/USD has been facing immense turbulence throughout the past several hours, with sellers forcing its price down to the lows of $54,261. If bulls decide to push the market price above the 9-day and 21-day moving averages, the coin may likely hit the resistance at $57,000 and above.
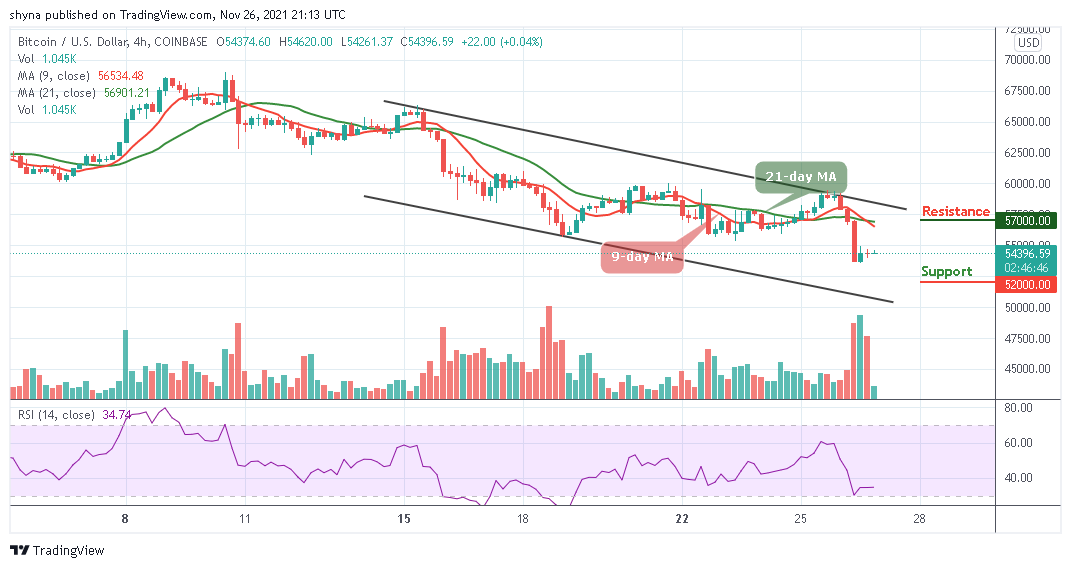
However, it now appears that the cryptocurrency is now ready for further upside in the near term, as the multiple attempts to shatter its $55,000 resistance seem to indicate that bears are building momentum. As the technical indicator Relative Strength index (14) moves below 35-level, any further drop may locate the critical support at $52,000 and below.
Looking to buy or trade Bitcoin (BTC) now? Invest at eToro!
68% of retail investor accounts lose money when trading CFDs with this provider
Read more: