
Litecoin Price Prediction: LTC/USD Trades Near $230 Resistance

Litecoin Price Prediction – November 25
According to the daily chart, the Litecoin price prediction is seem maintaining its position as the bulls desire to push the coin above the 9-day moving average.
LTC/USD Market
Key Levels:
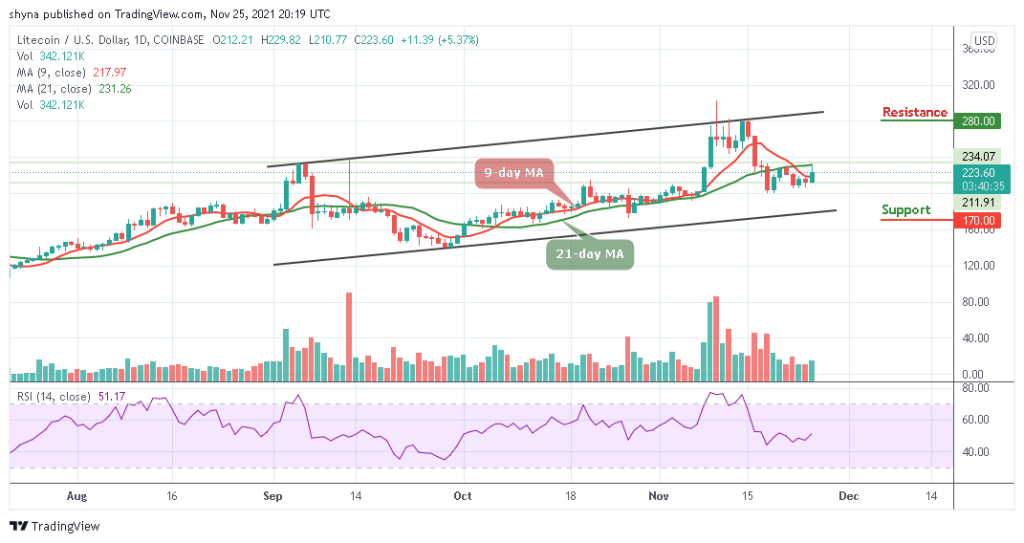
Resistance levels: $280, $300, $320
Support levels: $170, $150, $130
After being locked below the 9-day and 21-day moving averages on the price charts for the past few days, LTC/USD undergoes a much-needed break to the positive side as the market opens today. The Litecoin price is currently posting gains of over 5.37% within the chart, with the coin aiming to cross above the 21-day moving average at a price of $229.82.
Litecoin Price Prediction: Litecoin (LTC) May Bounce Back
The Litecoin price resumes back in the middle of consolidation after a slight drop below the 9-day and 21-day moving averages. The Litecoin price is now moving towards the upside. In the meantime, if the market price continues the surge and move towards the upper boundary of the channel, the $250 resistance level is likely to surface in the next few positive moves and the Litecoin price might further look for higher price levels if the bulls continue to show commitment.
Presently, the market is displaying a sign of subduing volatility with choppy price action. If the Litecoin price decides to stay under the control of bears, the price may roll back to the previous supports at $170, $150, and $130 below the lower boundary of the channel. But on the upside, traders can expect the next level of resistance at $280, $300, and $320. In addition, the technical indicator Relative Strength Index (14) is moving above 50-level, which indicates that bullish movement may play out.
Comparing with Bitcoin, the Litecoin price is seen crossing above the 9-day and 21-day moving averages in other to reach the resistance at 4000 SAT. Unless this resistance is effectively exceeded and the price ends up closing above it, there might not be any reason to expect the long-term bullish reversal.
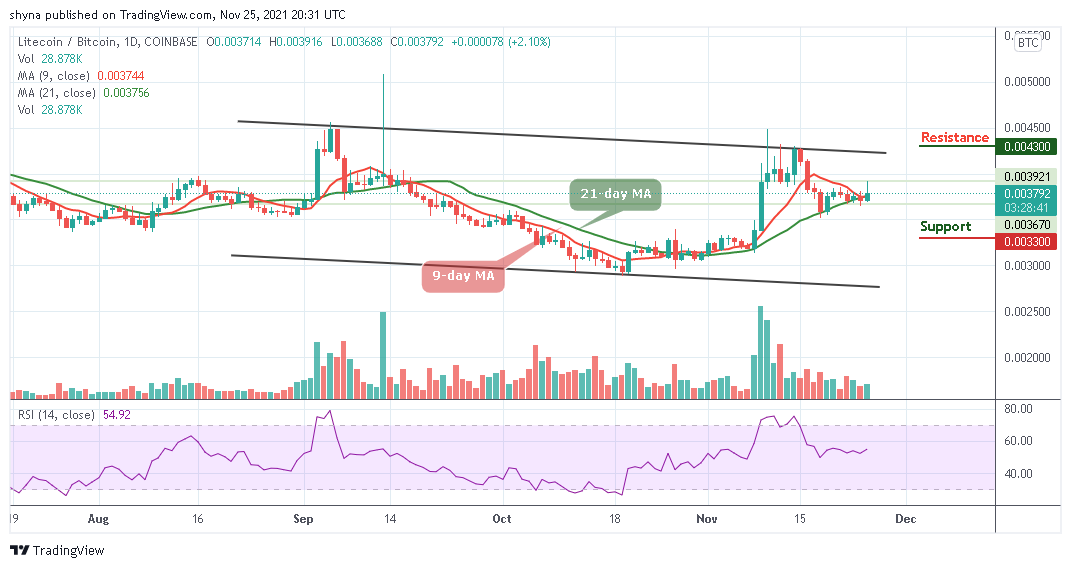
However, trading below the moving averages could refresh lows under 3600 SAT and a possible bearish continuation may likely meet the critical support at 3300 SAT and below while the buyers may push the coin to the potential resistance level of 4300 SAT and above as the technical indicator Relative Strength index (14) prepares to cross above 60-level, suggesting more bullish signals.
Looking to buy or trade Litecoin (LTC) now? Invest at eToro!
68% of retail investor accounts lose money when trading CFDs with this provider