

Bitcoin Price Prediction: BTC/USD Turning Bearish Below $47,000

Bitcoin Price Prediction – March 30
The Bitcoin price extends the bearish movement below the opening price of $47,000 after numerous trials to sustain gains above $48,000.
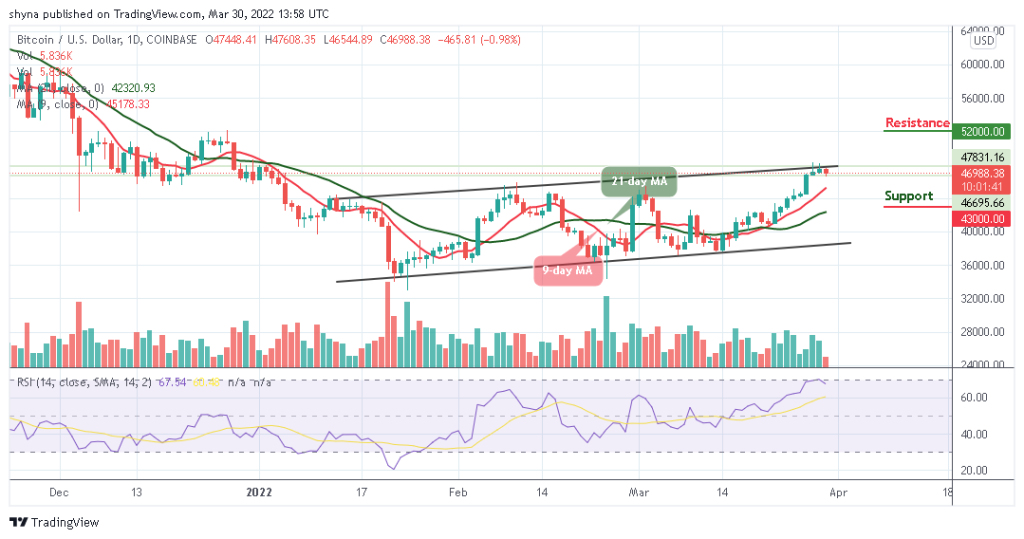
BTC/USD Long-term Trend: Ranging (Daily Chart)
Key levels:
Resistance Levels: $52,000, $54,000, $56,000
Support Levels: $43,000, $41,000, $39,000
BTC/USD could not cross above the resistance level of $48,000 today as the largest cryptocurrency embarked on a support smashing exercise after failing to hold above $47,000. Therefore, the bearish control is likely to play out across the market with other major digital assets posting similar losses as they trade below the upper boundary of the channel.
Bitcoin Price Prediction: Bitcoin (BTC) Could Add More Pains
The Bitcoin price is hovering at $46,988 with an intraday loss of 0.98%. The incoming trend is bearish with expanding volatility, and the first digital asset is likely to consolidate in a bearish flag pattern. Meanwhile, a breakdown below the 9-day moving average is supposed to continue according to the technical indicator Relative Strength Index (14). In this case, BTC/USD is expected to drop and stay below to hit the critical support levels at $43,000, $41,000, and $39,000.
However, should the Bitcoin price cross above the upper boundary of the channel; the price could rise to $50,000 vital resistance. A further bullish drive could push the price to $52,000, $54,000, and $56,000 resistance levels. The technical indicator Relative Strength Index (14) is revealing a slightly bearish movement, which shows that the market may experience a downtrend.
BTC/USD Medium-Term Trend: Bullish (4H Chart)
At the opening of the market today, the Bitcoin price faces up to touch the resistance level of $47,608 but begins to drop, bringing its price to trade around $47,100. Meanwhile, should the price continue to drop further and move below the lower boundary of the channel, it could reach the support level at $44,500 and below.
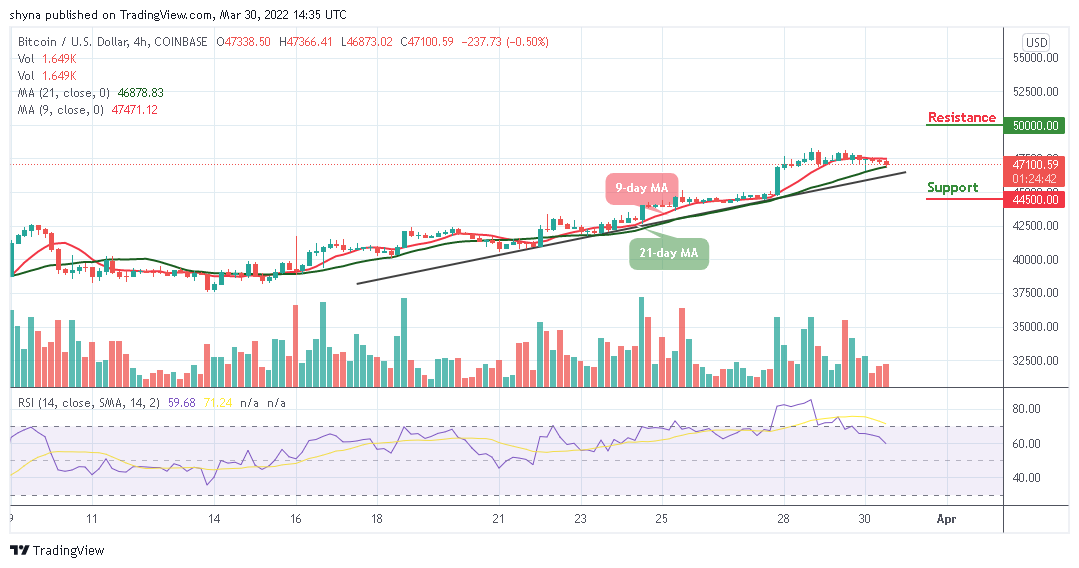
Moreover, if the bulls push the coin above the 9-day moving average, the Bitcoin price could visit the resistance level of $50,000 and above. Presently, the market may experience more downtrends as the Relative Strength Index (14) moves to cross below the 60-level.
Looking to buy or trade Bitcoin (BTC) now? Invest at eToro!
68% of retail investor accounts lose money when trading CFDs with this provider
Read more: