

Bitcoin Price Prediction: BTC/USD Still Trading Under $58,000

Bitcoin Price Prediction – November 24
The Bitcoin price drop today as the cryptocurrency breaks beneath $57,000 and heads toward $55,000.
BTC/USD Long-term Trend: Ranging (Daily Chart)
Key levels:
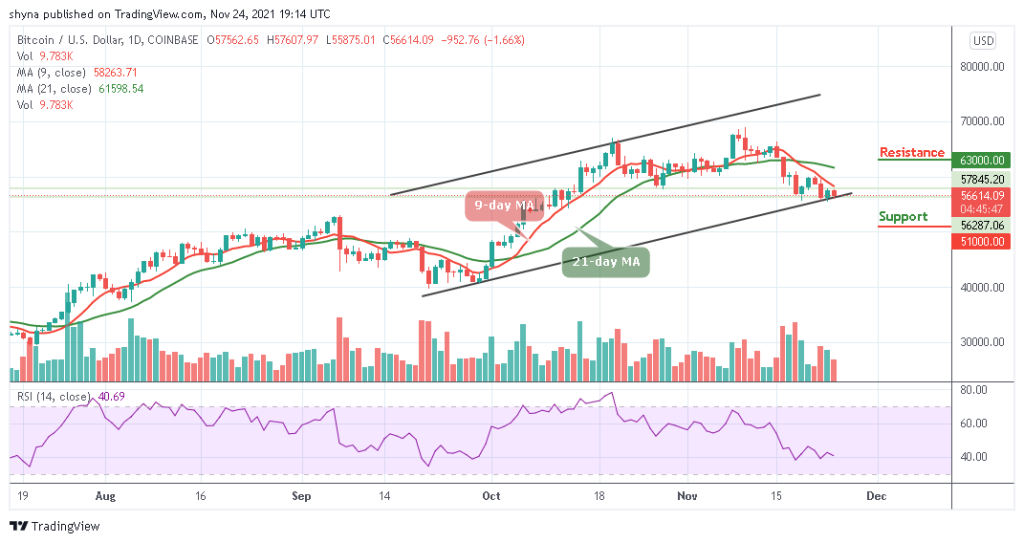
Resistance Levels: $63,000, $65,000, $67,000
Support Levels: $51,000, $49,000, $47,000
BTC/USD is seen dropping with another loss of 1.66% as the cryptocurrency keeps falling below the 9-day and 21-day moving averages to reach the daily low at $55,875. Looking at the daily chart, the resistance level of $58,000 is a very important level as it could provide a strong resistance for the market on its way to the upside.
Bitcoin Price Prediction: Bitcoin Price Ready to Fall More
The Bitcoin price is currently trading below the 9-day and 21-day moving averages, with support provided by the lower boundary of the channel. However, a break below this trend line could cause Bitcoin to slide towards the $55,000 level. However, the king coin is currently in a critical position as the next few days may dictate the direction it will take over the next few weeks. Therefore, a drop below $53,000 could be detrimental to Bitcoin as it could lead the first digital asset to the supports of $51,000, $49,000, and $47,000.
Furthermore, if the buyers can rebound from the current level, the first resistance level could be located above the 9-day moving average. Additionally, further resistance is expected at $60,000. This could likely follow potential resistance at the $63,000, $65,000, and $67,000 levels. Currently, the Relative Strength Index (14) is facing south, preparing to drop below 40-level.
BTC/USD Medium-Term Trend: Bearish (4H Chart)
As reveals by the 4-hour chart, the Bitcoin price is seen hovering at $56,888 as the coin trades around the 9-day moving average with buyers pushing the price to the upside. However, if the bulls decide to push the market price above the upper boundary of the channel, the coin could find potential resistance at $59,000 and above.
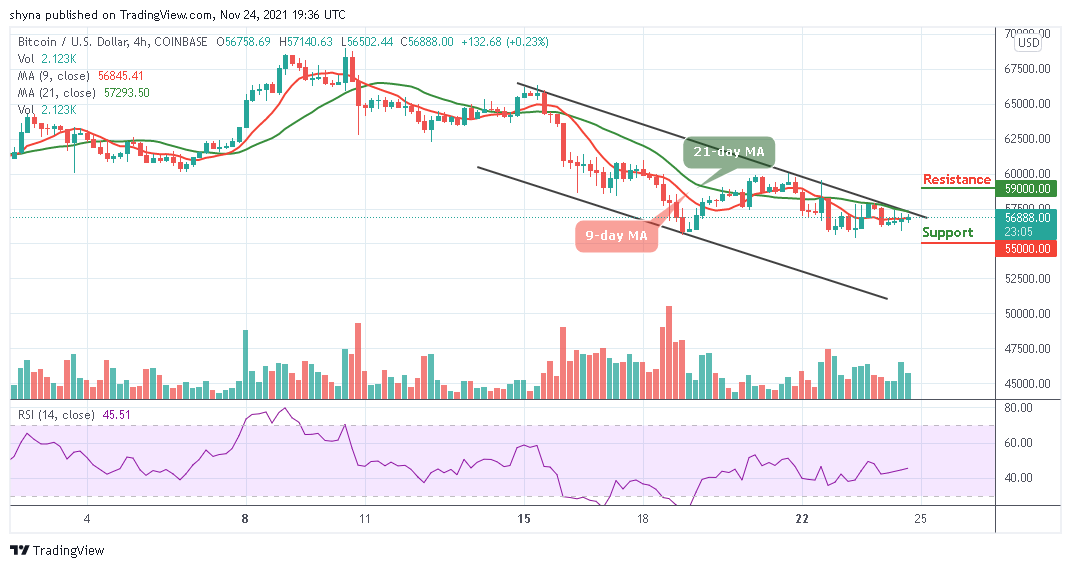
However, it now looks like the cryptocurrency is getting ready for the bullish movement but if the coin retreats back below the 9-day moving average, the market price may touch the nearest support at $56,000. Meanwhile, if the Relative Strength Index (14) moves below 45-level, the coin may locate the critical support at $55,000 and below.
Looking to buy or trade Bitcoin (BTC) now? Invest at eToro!
68% of retail investor accounts lose money when trading CFDs with this provider
Read more: