

Bitcoin Price Prediction: BTC/USD Stays Above the Moving Averages; Recovery May be Limited by $55,000 Level


Bitcoin (BTC) Price Prediction – March 5
BTC/USD is up by more than 6.94% as the price struck a sudden and bullish price spike.
BTC/USD Long-term Trend: Ranging (Daily Chart)
Key levels:
Resistance Levels: $62,000, $64,000, $66,000
Support Levels: $48,000, $46,000, $44,000
The daily chart reveals that BTC/USD is pushing the price above the crucial resistance level of $56,500. The coin is moving towards $57,000 to trade at $56,914 at the time of writing. However, the number-one crypto is moving with strong bullish momentum after a sustainable break above an important technical level. Meanwhile, BTC/USD has gained over 6% since the beginning of the day as it is currently using $53,000 support as a jumping-off ground to develop the upside momentum, which is now gaining traction.
What to Expect from Bitcoin (BTC)
As the king coin stays above the moving averages, the return below $57,000 could set the framework for gains towards $60,000. Meanwhile, the technical analysis shows that the bulls are ready for action especially when the up-trending RSI (14) is considered. Therefore, any further bullish movement towards the upper boundary of the channel could pave the way for gains above $58,500 before reaching the resistance levels of $62,000, $64,000, and 66,000.
Looking at the downside, if the price falls back below the $55,000 level and move to cross below the lower boundary of the channel, the bears may wrestle out control over the situation very quickly. This may likely serve as a major blow for the market sentiments as traders could interpret it as a sign of underlying weakness. The next critical support may come at $52,000, which may be followed by $48,000, $46,000, and $44,000 support levels.
BTC/USD Medium – Term Trend: Bullish (4H Chart)
The 4-hour chart reveals that the market is showing a sign of weakness as the price couldn’t stay above the moving averages. However, the intraday trading is looking bullish; following the recent rebound at $53,000 which is the key support level. If the coin trades below the moving averages, it could meet the next key support level at $55,000 and below.
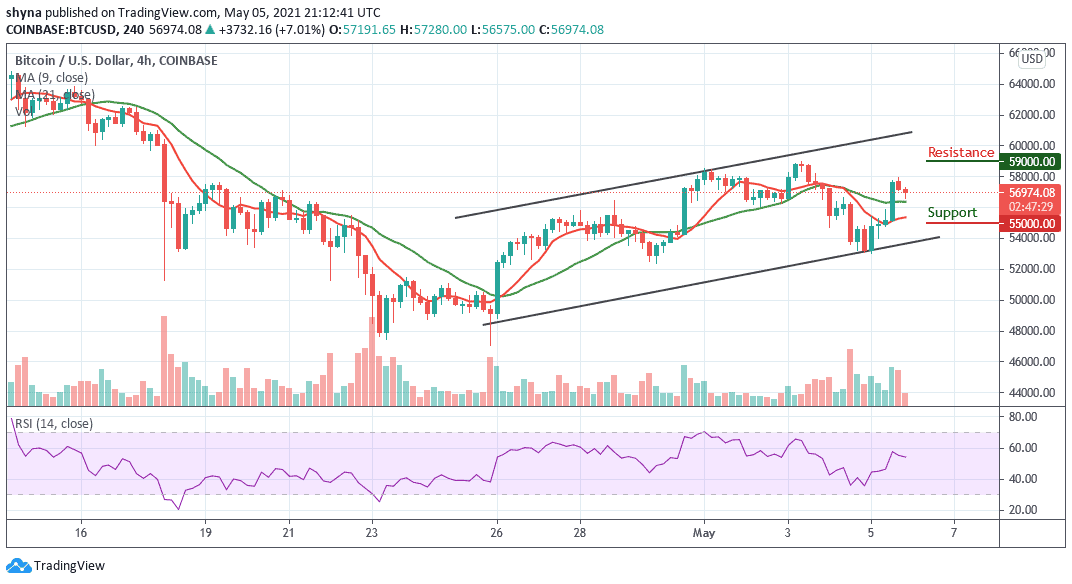
However, considering the recent sharp rebound, the Bitcoin price may re-enter the bullish rally to $57,000 resistance. A climb above the mentioned resistance may further push BTC price to the resistance level of $59,000 and above. In other words, the technical indicator RSI (14) faces down, suggesting downward movement.