

Bitcoin Price Prediction: BTC/USD Retraces Above $59,000

Bitcoin Price Prediction – November 25
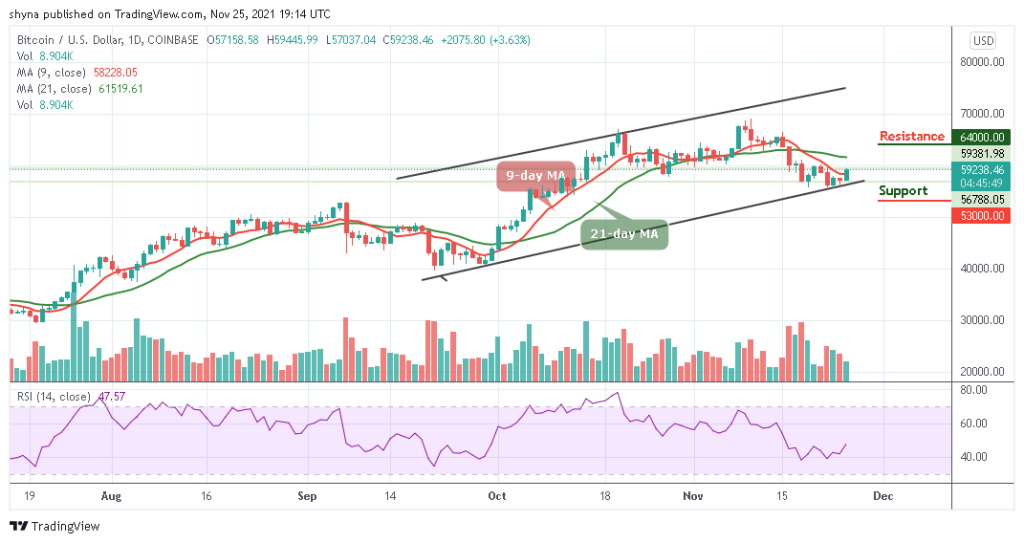
The Bitcoin price rebounds from the opening price of $57,158 as the buying interest may increase on approach to $60,000.
BTC/USD Long-term Trend: Ranging (Daily Chart)
Key levels:
Resistance Levels: $64,000, $66,000, $68,000
Support Levels: $53,000, $51,000, $49,000
BTC/USD is ranging as the market establishes a higher high low around $59,238 but currently rebounding to retest previous resistance at $60,000. The bulls may continue to find some resistance levels above the 9-day and 21-day moving averages on the road to recovery.
Bitcoin Price Prediction: BTC Price May Move Higher
In the past few hours, after the Bitcoin price begins the daily trading at $57,158, the king coin is now facing the resistance level of $60,000 and looking forward to reclaiming the resistance level of $62,000. However, the daily chart reveals that if the 9-day moving average crosses above the 21-day moving average, it will confirm the next direction that the coin will follow. On the contrary, BTC/USD may decline if the $57,000 support breaks down but the price could rise if the $60,000 resistance is reached.
Meanwhile, the technical indicator Relative Strength Index (14) is likely to cross above 50-level, indicating a bullish movement. Therefore, if the Bitcoin price stays above the 9-day moving average, it could cross the 21-day moving average and hit the resistance levels of $64,000, $66,000, and $68,000 but any movement below the lower boundary of the channel may hit the supports at $53,000, $51,000, and $49,000.
BTC/USD Medium-Term Trend: Ranging (4H Chart)
According to the 4-hour chart, the Bitcoin price is seen rebounding as the technical indicator Relative Strength Index moves around 60-level. Looking at the upside, if the Bitcoin price keeps moving above the 9-day and 21-day moving averages, bullish influence may spike and the accrued gains massively.

In the meantime, the current market movement may fail to cross below the moving averages and the nearest support level could be located at $57,000 and below but the best the bulls can do is to hold above the resistance level of $58,000 and keep their attention on breaking the potential resistance at $62,000 and above.
Looking to buy or trade Bitcoin (BTC) now? Invest at eToro!
68% of retail investor accounts lose money when trading CFDs with this provider
Read more: