

Bitcoin Price Prediction: BTC/USD Prepares for a Break out Above $47,000

Bitcoin Price Prediction – March 29
The Bitcoin price prediction is showing positive signs, and it is likely to accelerate further higher in the near term.
BTC/USD Long-term Trend: Ranging (Daily Chart)
Key levels:
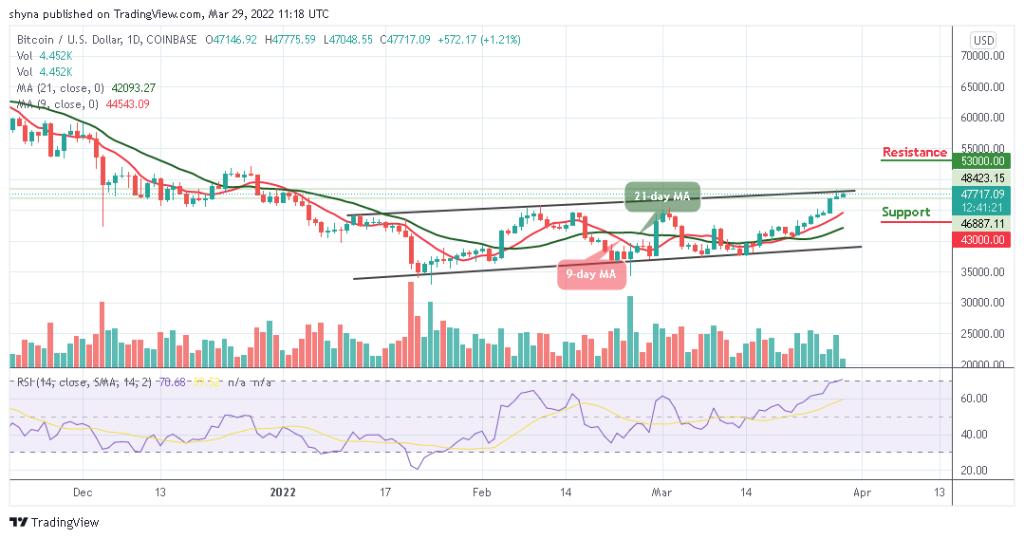
Resistance Levels: $53,000, $55,000, $57,000
Support Levels: $43,000, $41,000, $39,000
According to the daily chart, BTC/USD stays above the resistance level of $47,000 as all-time high beckons. The king coin is seen trading well above the 9-day and 21-day moving averages at $47,717. More so, the Bitcoin price is within touching distance of forming a new all-time high above the previous high of $48,000, which is quite remarkable.
Bitcoin Price Prediction: Bitcoin Price May Approach a Strong Resistance Level
At the time of writing, the Bitcoin price is trading comfortably towards the upper boundary of the channel as the price establishes a new bullish signal. Like the look of things, one could say that the long-term outlook favors the bulls, giving the daily close produced a large bullish engulfing candle with eyes now set on the daily resistances at $53,000, $55,000, and $57,000 respectively.
However, any drop from the current level could lead to declines in the critical support below the moving averages. In case BTC drops and touches the low of $45,000 support, then the coin can rely on the long-term support levels at $43,000, $41,000, and $39,000. Moreover, the technical indicator Relative Strength Index (14) is now moving near the overbought region, suggesting more bullish signals.
BTC/USD Medium-term Trend: Bullish (4H Chart)
On the 4-hour chart, the Bitcoin price remains above the 9-day and 21-day moving averages at $48,010. However, today’s price move saves the king coin from falling below the 9-day moving average. More so, BTC/USD is now maintaining its bull run above the moving averages as the technical indicator Relative Strength Index (14) moves within the overbought region.
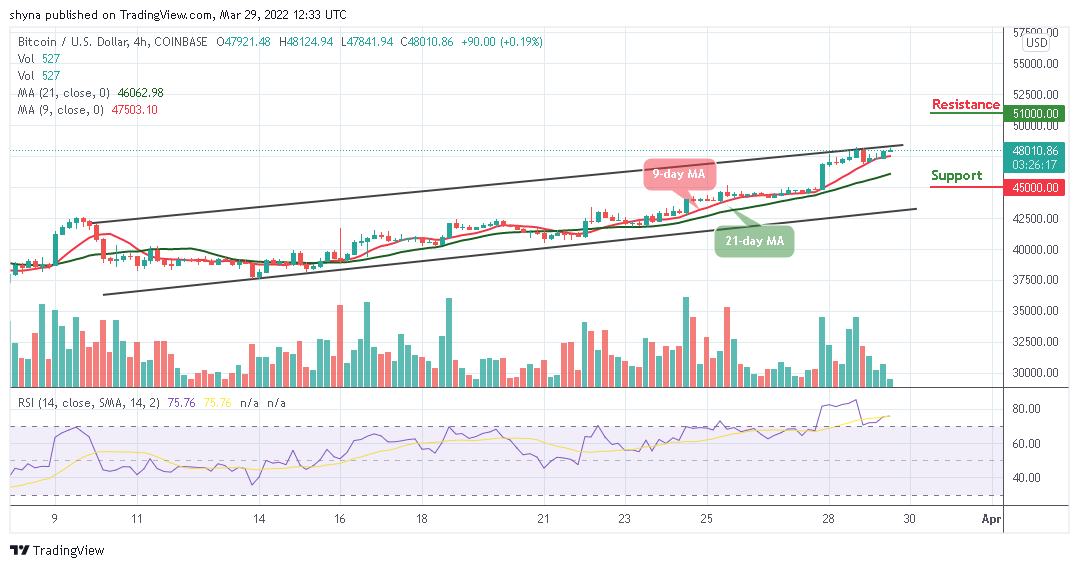
On the other hand, BTC may take a downward move if the bulls failed to push the price higher, and the coin may breach below the 9-day and 21-day moving averages to hit the support level of $45,000 and below. Nevertheless, if the bulls find a decent resistance level of around $50,000, the coin may continue bullish movement above the channel at the resistance level of $51,000 and above.
Looking to buy or trade Bitcoin (BTC) now? Invest at eToro!
68% of retail investor accounts lose money when trading CFDs with this provider
Read more: