

Bitcoin Price Prediction: BTC/USD Moves Close to $44,500 as Bulls Struggling to Keep the Uptrend

Bitcoin Price Prediction – March 26
The Bitcoin price prediction gains 0.42% as bulls keep working hard to nurture a bullish trend from the support at $44,000.
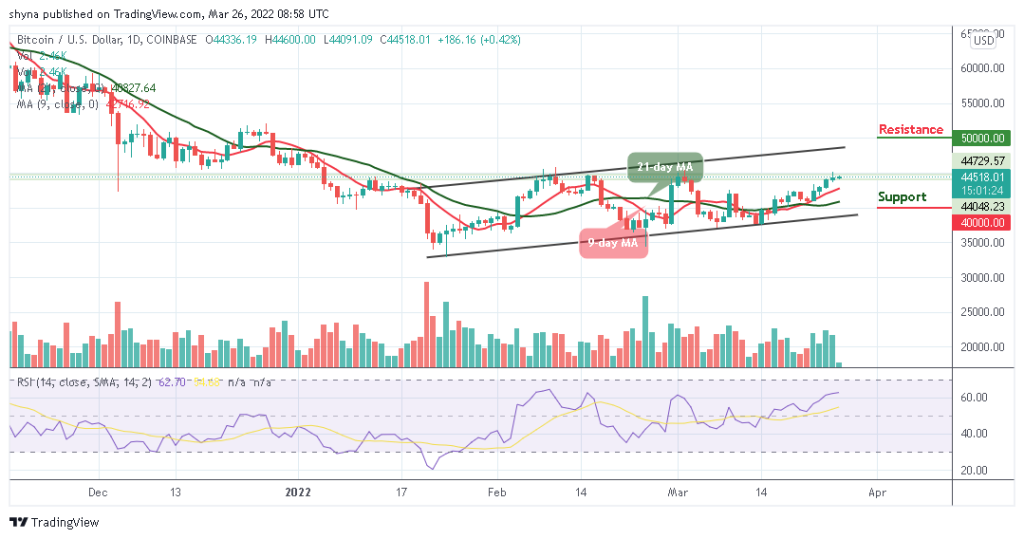
BTC/USD Long-term Trend: Ranging (Daily Chart)
Key levels:
Resistance Levels: $50,000, $52,000, $54,000
Support Levels: $40,000, $38,000, $36,000
BTC/USD is trading at the $44,518 resistance level. The market price is trading above the 9-day and 21-day moving averages, indicating an upward movement in cryptocurrency. For the past few days, the Bitcoin price has been towards the north and in the context of the Bitcoin exchange rate forecast; an application of $48,000 is expected.
Bitcoin Price Prediction: Will BTC Break Above $45,000 Resistance Level or Reverse?
If the Bitcoin price can retain the upward movement above the 9-day and 21-day moving averages, it is likely for the market price to touch the $46,000 level. This is where traders should expect buyers to fight for a further rise in BTC/USD and further development of the bullish trend. However, the purpose of this movement is to provide a level of resistance close to $48,000.
However, the best area for traders to buy BTC is when the red-line of 9-day MA crosses above the 21-day MA and when the price is stable at the resistance level of $45,000 while the technical indicator Relative Strength Index (14) signal line is considering the way above 60-level.
Meanwhile, there is likely that it may experience a quick retracement or sell-off just in case it touches the crucial $48,000 level, if not; traders may see additional resistance levels of $50,000 and $52,000 before pushing to $54,000. On the downside, if the market decides to fall, the price of Bitcoin could fall below the moving averages and could see a further decline towards the support levels of $40,000, $38,000, and $36,000.
BTC/USD Medium – Term Trend: Ranging (4H Chart)
On the 4-hour chart, traders expect the coin to gain the lost momentum and hit the trade above $45,000. On the contrary, if the selling pressure still exists and holds the coin not to be able to cross above the moving averages, the $42,000 and below may come into play.
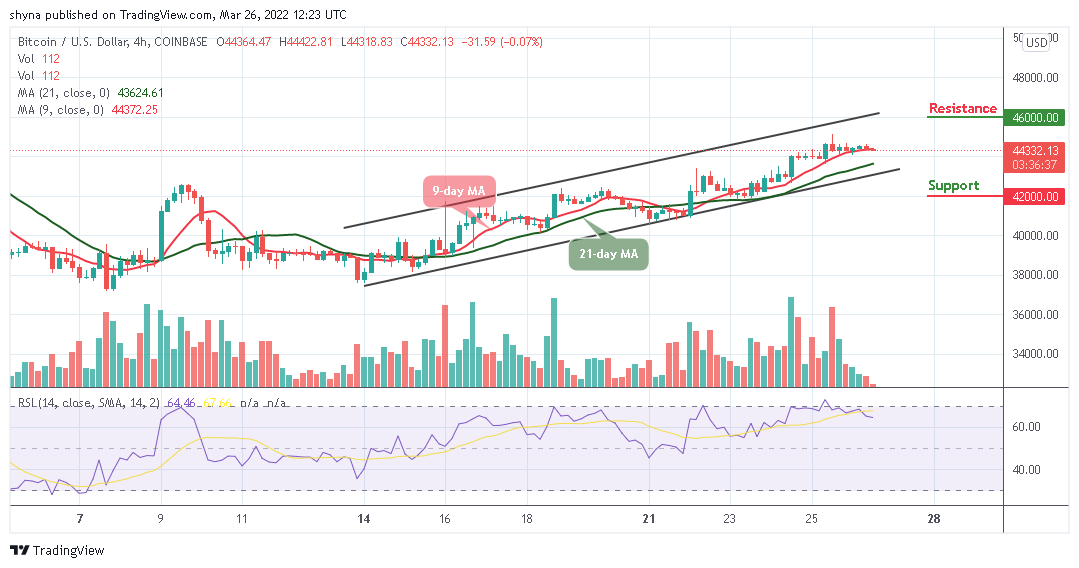
However, in as much as the buyers keep the price above the moving averages, traders may expect a strong bullish movement that could hit the resistance at $46,000 and above. Meanwhile, the technical indicator Relative Strength Index (14) is moving around 65-level, suggesting that more bearish signals may play out.
Looking to buy or trade Bitcoin (BTC) now? Invest at eToro!
68% of retail investor accounts lose money when trading CFDs with this provider
Read more: